| A Powerful Technical Analysis   Charting Software featuring popular Indicators, Oscillators, Line Studies and   Chart Patterns. Meta-Chart is flexible, very simple to use and feature rich. It   is an excellent combination of latest cutting-edge technology and our expertise   in the Technical Analysis domain.  So, let us have a look at some of the   features of this outstanding Software…  Significant   Features           
            Chart   Types   
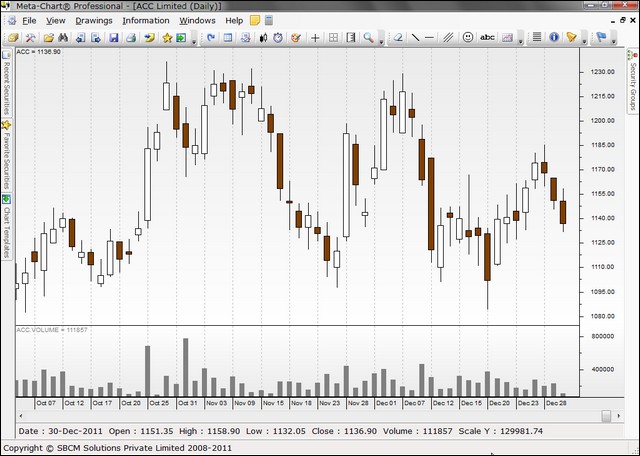
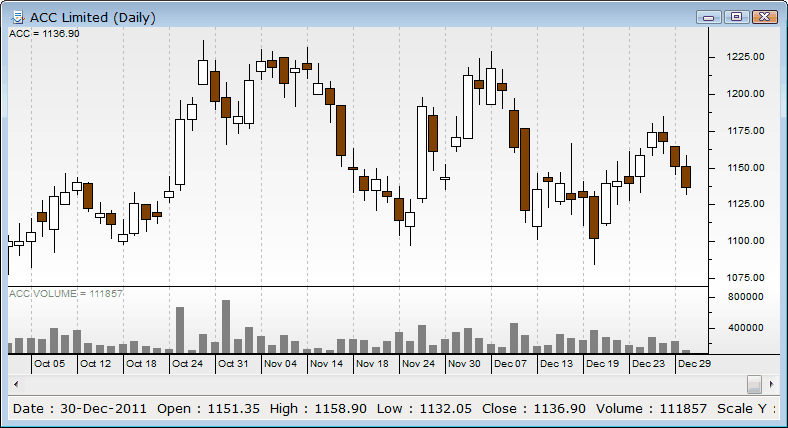
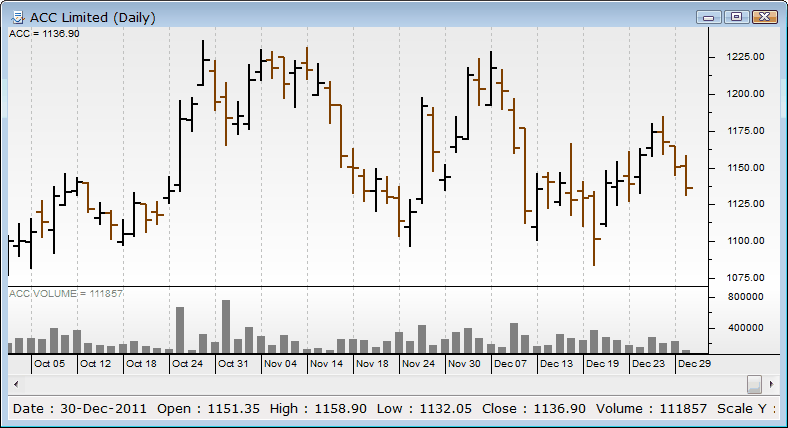
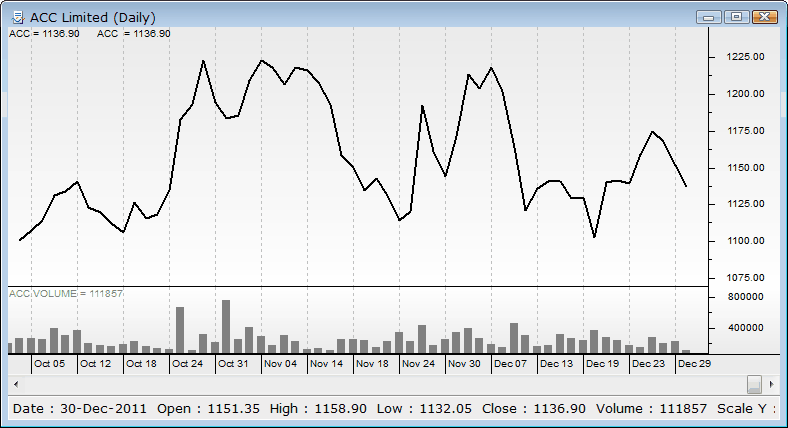
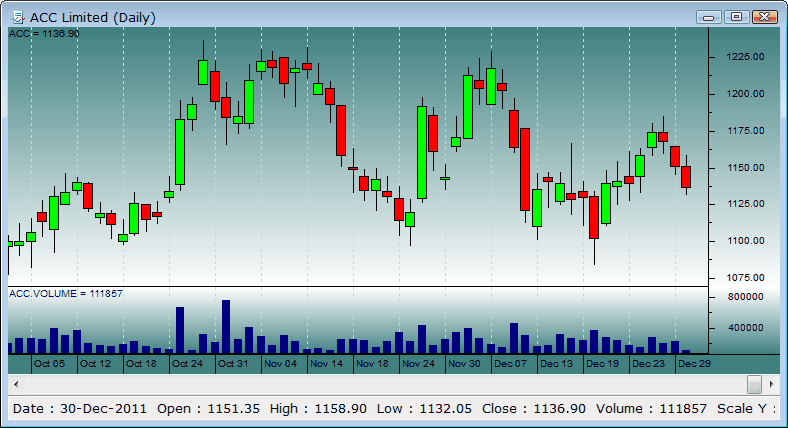
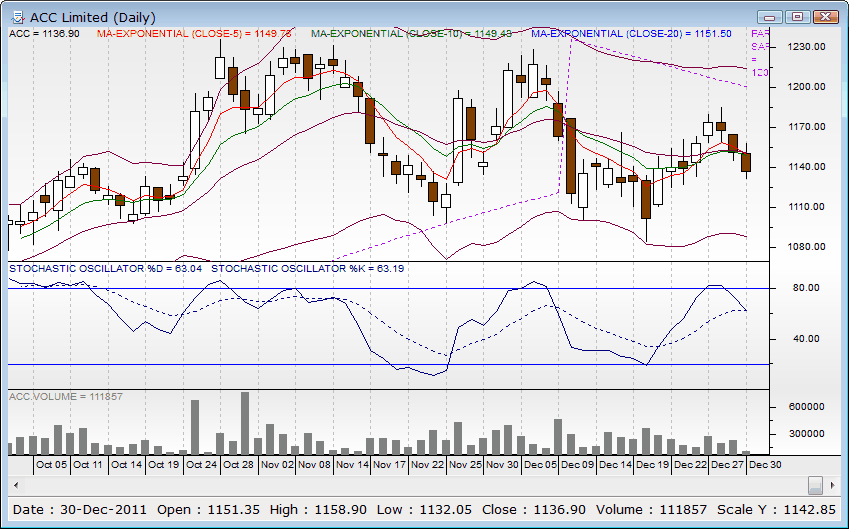
· Candle · Bar (OHLC) · Bar (HLC) · Line              
            Chart   Periodicity  · Daily · Weekly · Monthly · Quarterly · Yearly  
            Line   Studies 
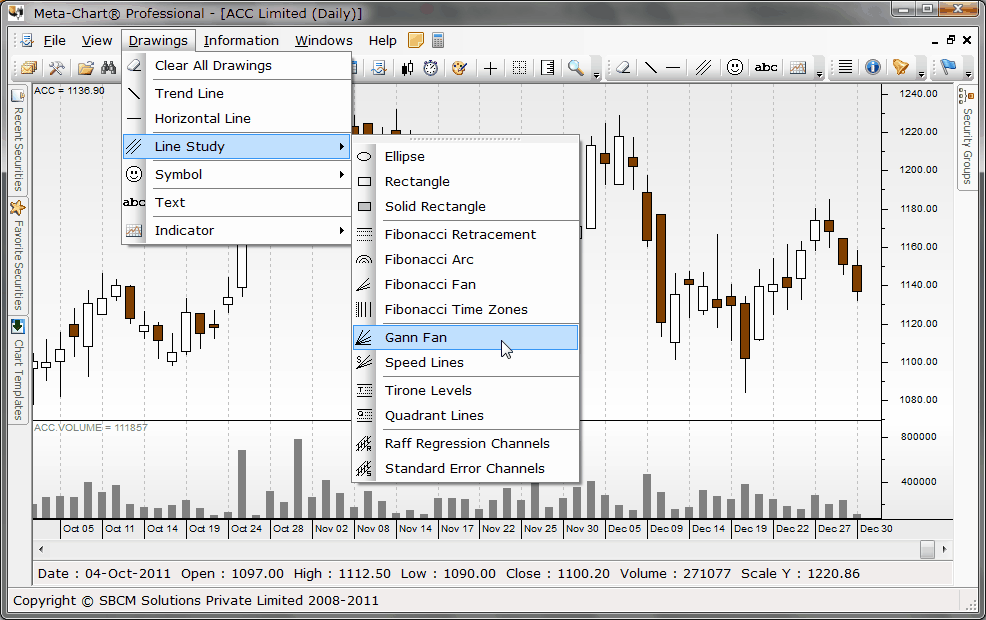
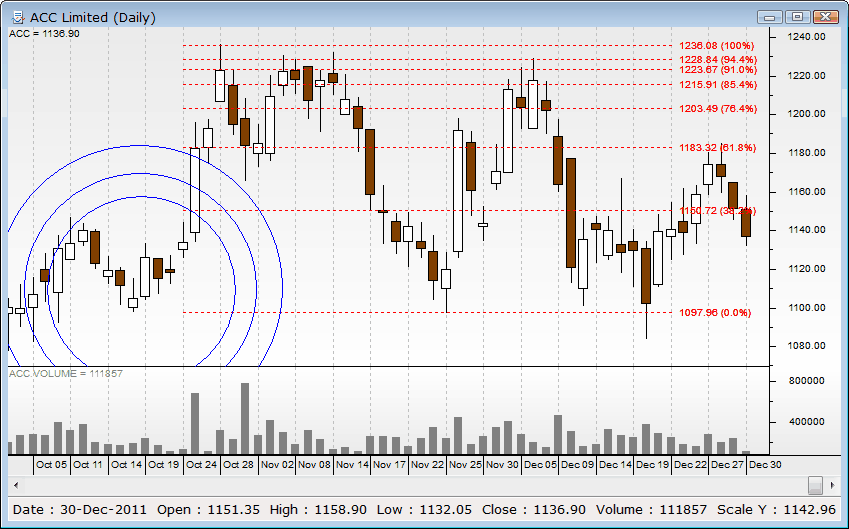
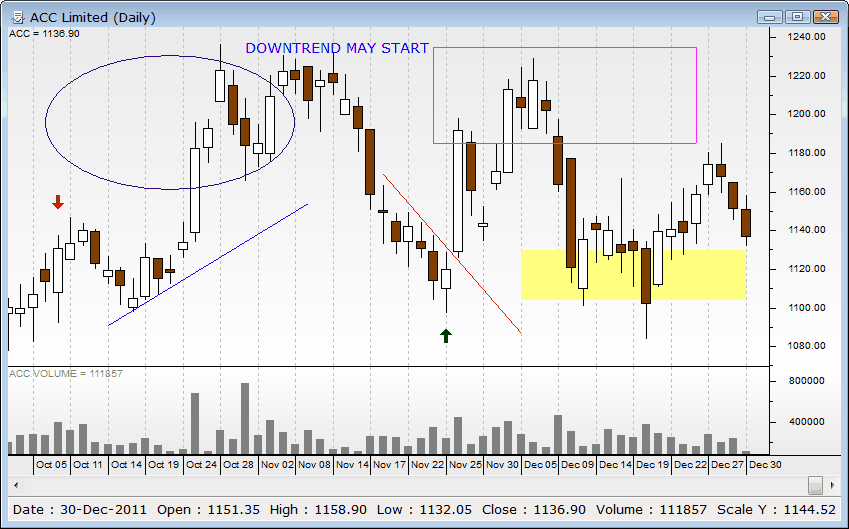
· Trend Line · Ellipse · Rectangle · Fibonacci Retracements · Fibonacci Arc · Fibonacci Fan · Fibonacci Time Zones · Gann Fan · Speed Lines · Tirone Levels · Quadrant Lines · Raff Regression · Standard Error Channels  
            Technical   Indicators  
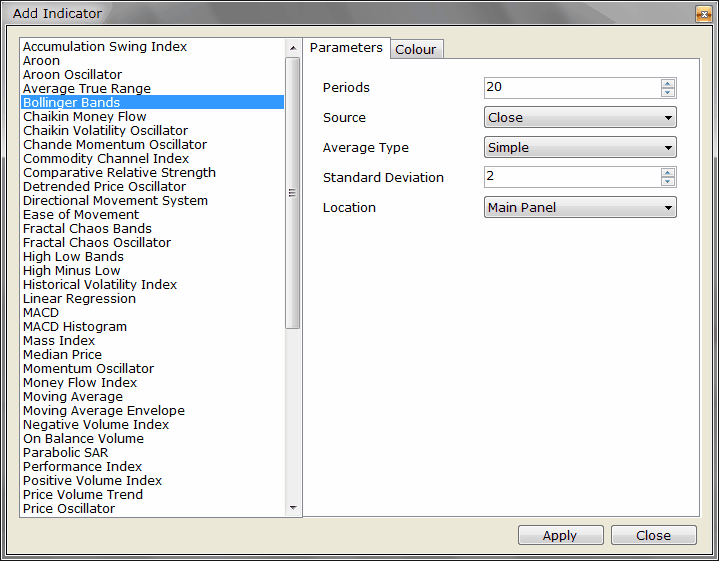
· Accumulation Swing Index · Aroon · Aroon Index and Oscillator · Average True Range · Bollinger Bands · Chaikin Money Flow · Chaikin Volatility   Oscillator · Chande Momentum Oscillator · Commodity Channel Index · Comparative Relative   Strength · Detrended Price Oscillator · Directional Movement   System · Ease of Movement · Fractal Chaos Bands · Fractal Chaos Oscillator · High Low Bands · High Minus Low · Historical Volatility   Index · Linear Regression · MACD · MACD Histogram · Mass Index · Median Price · Momentum Oscillator · Money Flow Index · Moving Average · Moving Average Envelope · Negative Volume Index · On Balance Volume · Parabolic SAR · Performance Index · Positive Volume Index · Price and Volume Trend · Price Oscillator · Price Rate of Change (ROC) · Prime Numbers Bands · Prime Numbers Oscillator · Rainbow Oscillator · Relative Strength Index   (RSI) · Standard Deviations · Stochastic Momentum Index · Stochastic Oscillator · Swing Index · Trade Volume Index · TRIX · Typical Price · Ultimate Oscillator · Vertical Horizontal Filter · VIDYA Moving Average · Volume Oscillator · Volume Rate of Change   (ROC) · Weighted Close · Welles Welder's Smoothing · William's %R · William's   Accumulation/Distribution     
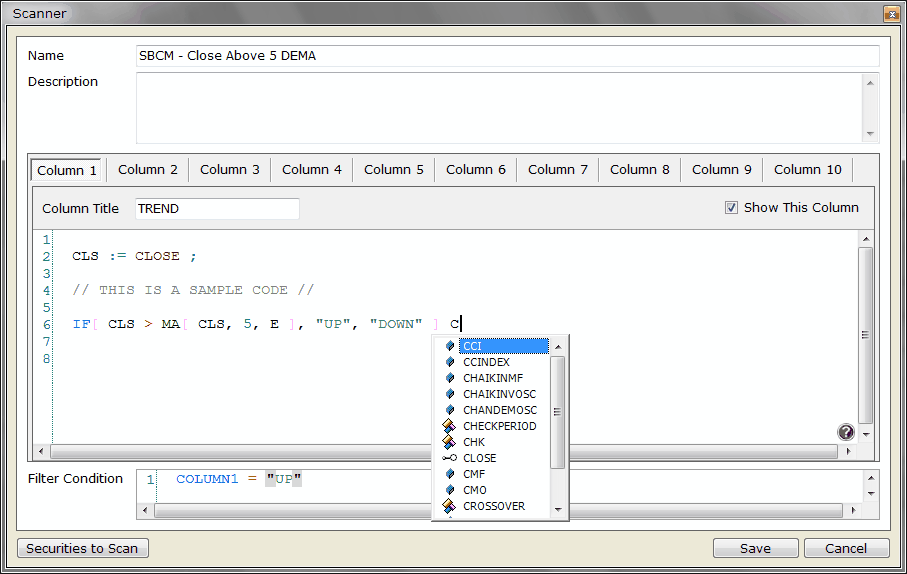
Operational   Features  
            
              User can open Multiple Securities, at a same time
               User defined Chart Colours
               Zoom In/Out/All or selected period options
               Facility to Export Security Data to CSV file
               Facility to record Security specific Notes
               User can Save Chart as BitMap or Print it.
               Facility to plot Buy/Sell etc. Symbols to Chart
               Facility to add Text to Chart
               Resistance / Support Levels with Median, for Next Session
               Saves Security Analysis Status, automatically                Additional   Features  
            · Aesthetic User Interface · Extremely simple to use · Well-Organized and Easy-To-Use Menu   and ToolBar · Reads MetaStock format Security Data   files 
            
              |  |  
              | 
                      In addition to all of its above mentioned exclusive features,
                      Meta-Chart® Professional is now having latest Brand 
                      New User Interface, loaded with Drag-Drop Toolbars with full customization, 
                      Dockable Sliding Windows and Tearable Menus. It has also come with Keyboard 
                      ShortCuts, Chart Templates and Cool Themes. Favorite Securities List is also 
                      added to maintain a listing of your selected securities. You may now open Next 
                      or Previous security from the selected folder, directly from the Toolbar.
                   |  
              |  |  
              |  |  
              | Meta-Chart® Professional comes with 
                  DSS Navigator |  
              |  |  
              | Click Here, to know more about DSS Navigator |  
              |  |  
              |  |  
              | Features, Pricing and Schemes are subject to change, without notice  |    |